archives –––––––– @btnaughton
Brian Naughton | Sun 14 January 2024 | datascience | datascience ai llm

I wrote about querying research papers with LLMs last February. Since then things have progressed a lot, with significant new LLM results seemingly every week. However, I think it's fair to say there is still no turnkey way to search PubMed, load a corpus of PDFs into an LLM, query, and get good quality results. (If I've missed something great, let me know...)

There are several options:

  • The tools I used in my previous article, Paper QA and LlamaIndex, can work well if you already have a corpus of papers. Indexing papers with GPT-4 can get expensive though.

  • New RAG (Retrieval Augmented Generation) tools like RAGatouille (which uses the new ColBERT model, now built into LangChain)

  • All-in-one local LLM UIs like gpt4all

  • Web-based scientific services like elicit.org and scite.ai. I can't tell exactly which papers these tools have access to. scite.ai seems to be focused on "citation statements" (what?) and elicit.org on abstracts. I imagine it is difficult for these services to get access to all full text articles.

As of January 2024, GPT-4 still dominates all open-source models in terms of reasoning performance, but it is expensive for larger projects, so for now I am still exploring and comparing approaches. (For various reasons, I could get neither RAGatouille nor gpt4all to run on my mac!)

Long context

One really useful recent development in LLMs is long context (>100,000 tokens, or >100,000 words, approximately). A few models now have long context: GPT-4 Turbo, Claude, and some open-source models like Anima. By comparision, GPT-3 launched with a context length of only 2,048 tokens — barely enough to hold a few abstracts.

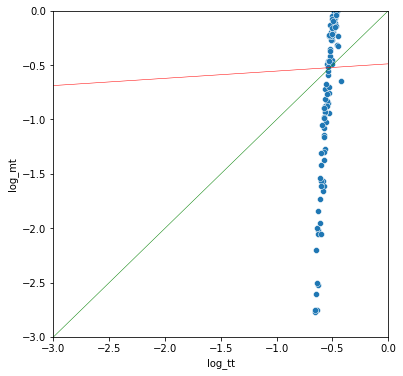
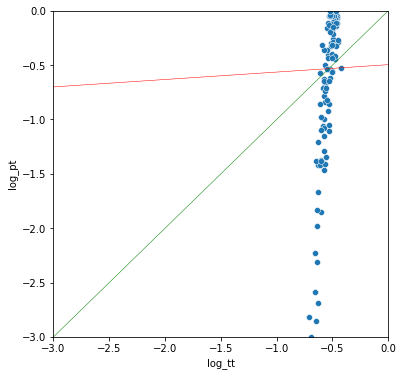
If you are trying to use an LLM to read and analyze documents, you have two main choices: you can fine-tune the model with additional training on a comparatively set of documents, or you can keep the default model and provide the document text directly in context. Perhaps surprisingly, it seems like the latter actually works fine, often better! Long context means you can directly load hundreds of pages of text into the model's memory. Intuitively, it does seem cleaner to keep the reasoning engine (LLM) separate from the domain knowledge (papers).


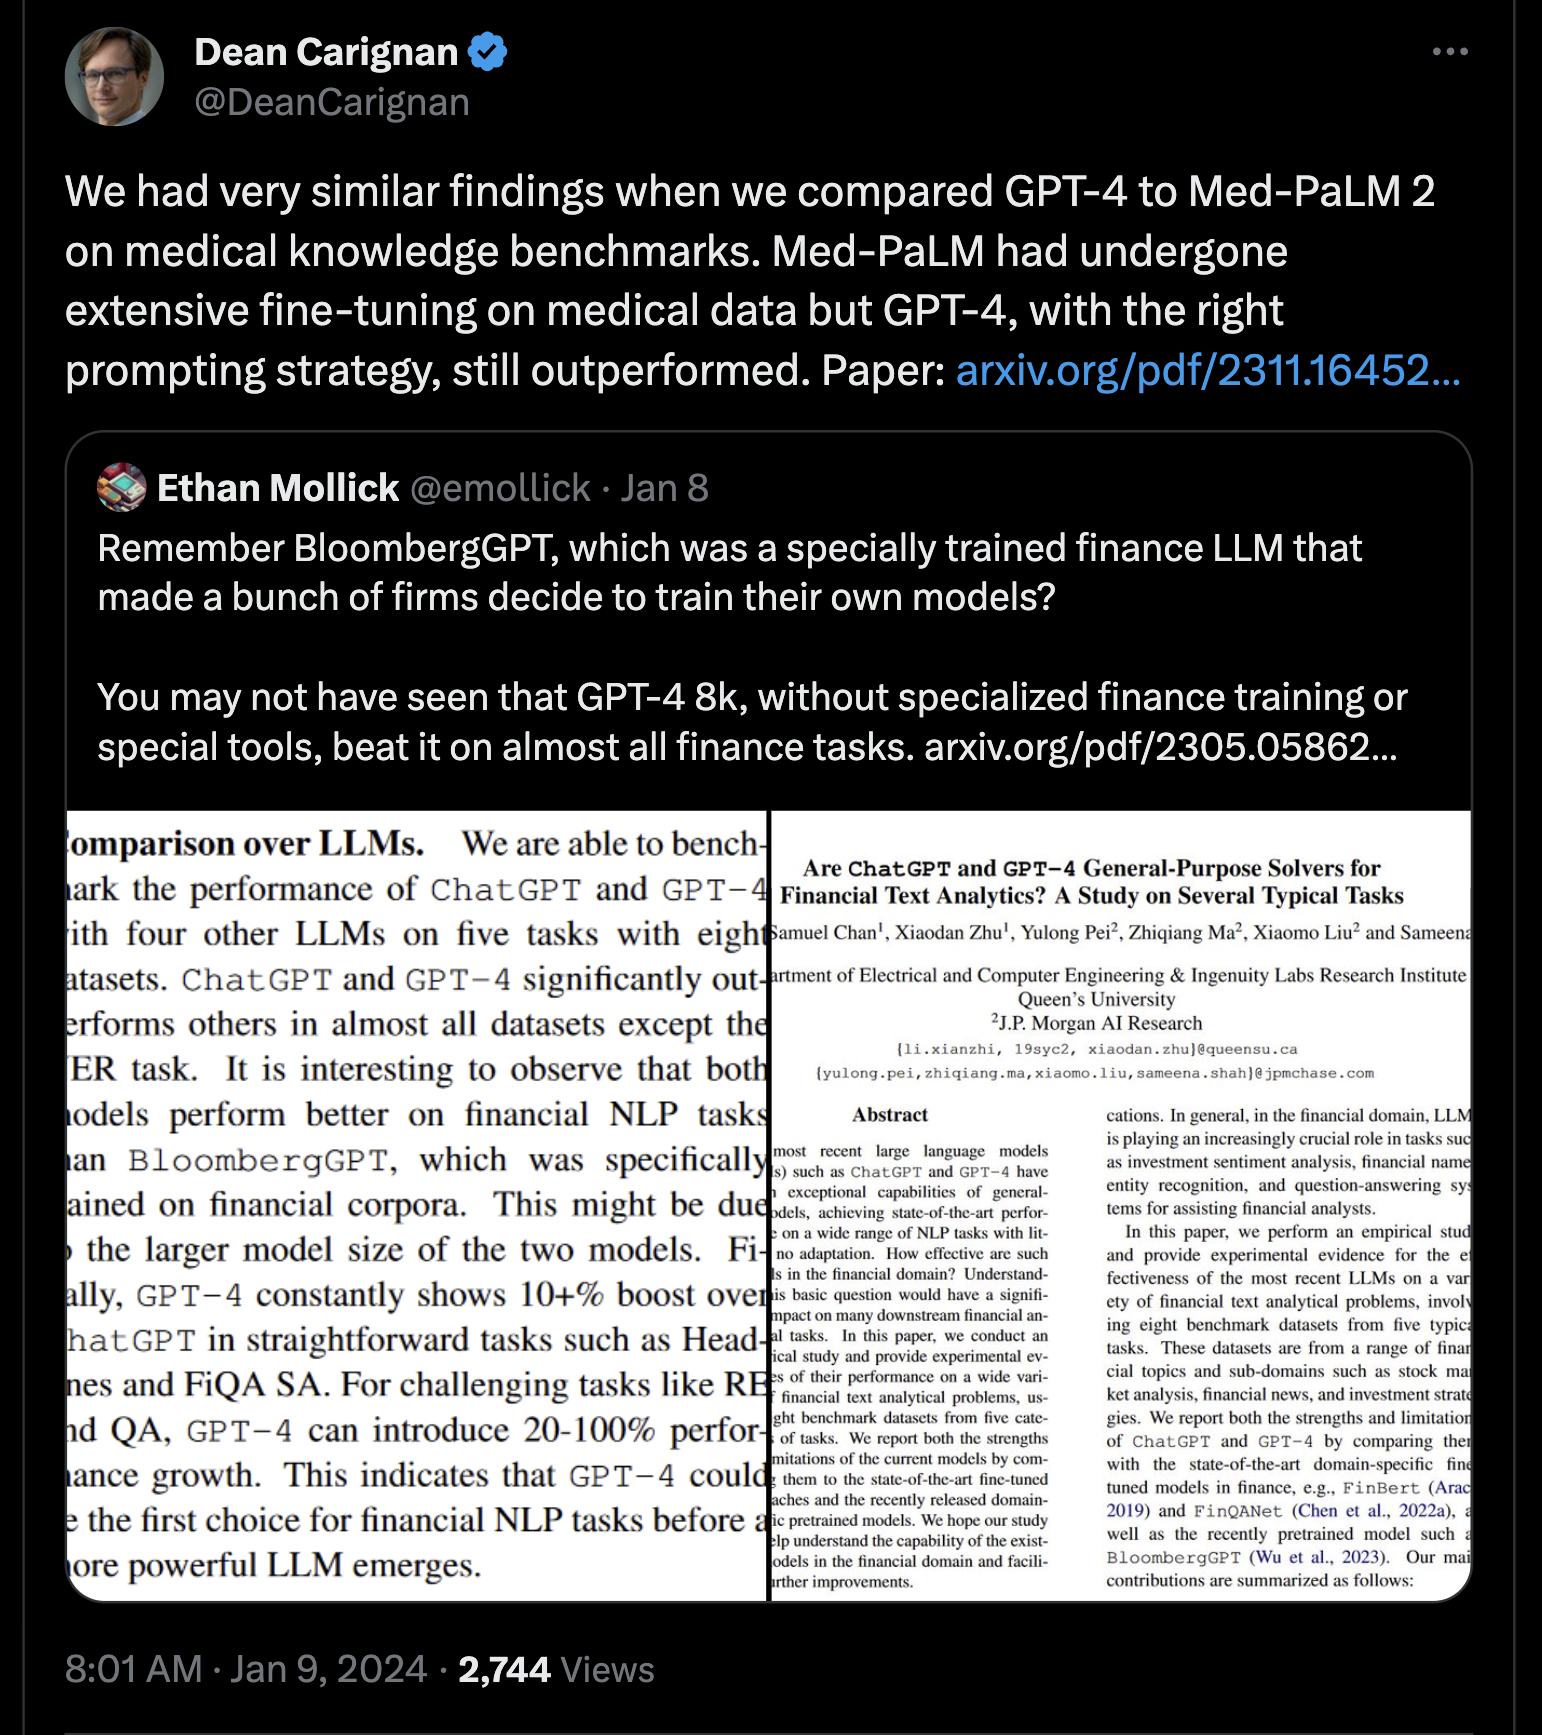
A recent post on twitter by @DeanCarignan

Notably, smaller contexts can work well with RAG, I assume because RAG pulls out only relevant passages, resulting in a better signal-to-noise ratio.

Text sources

For biomedical research, there are a few sources of text:

  • abstracts, available free online via PubMed and Google Scholar
  • full text papers (PDFs, HTML or JSON), some of which are available free via PubMed Central (more and more thanks to the NIH Public Access Policy)
  • patents, available free via USPTO or Google Patents
  • internet forums and discords. I have not actually looked into using this, but there is definitely a lot of high quality discourse on some discords.

BioC

BioC is a very useful format that is new to me. Essentially it's an NCBI-generated structured JSON file with annotated sections for "intro", "methods", etc.

Example BioC JSON

One unfortunate caveat is that I found not all PMIDs are available in BioC, even if the paper is available, so I have to use PMCIDs (PubMed Central publications) instead. No idea why, but I did email them about it.

Script

So here is a simple script that uses the PubMed and OpenAI APIs to rank a set of genes for a given "role" (e.g., ["MAP2K1", "F5"] and "cancer driver"). It searches PubMed, reads the abstracts to figure out if the gene has the specified role, summarizes the results in a JSON object, including a score from 0-10 that can be used for ranking. I found this script worked pretty well for me for ranking a few hundred genes — a task that would have been way too laborious for me to do — and it's a nice short script. The LLM prompt is far from optimized though, so buyer beware!

The long context model (GPT-4 Turbo) means I can simply include all the abstracts (I include the first 30) in the text of my query, and not worry about fine-tuning or RAG. The equivalent Paper QA script would have to additionally include an indexing and retrieval step, but could include the full text where available.

It feels strange to write these LLM scripts because most of the "code" is in English. The prompt engineering part took inspiration from Jeremy Howard from FastAI and this article from finedataproducts, which covers a lot of the same topics as this one, but in more depth.

Note that GPT-4 Turbo is still quite expensive, so although the results are pretty good, if you were attempting to search for all 20,000 genes in the human proteome, it would get expensive. Also, since you pay per token, the longer the context you provide, the more expensive it gets — proper RAG is probably a better idea for bigger projects!

Example results

Here are some results from running the script for the role "cancer driver". Note, the Summary field is an opportunity for the LLM to think "step-by-step". Surprisingly, the phrase "cancer driver" is not that commonly found with specific genes so some genes return no result.

Gene Cancer type Evidence Summary Score
MAT2A Leukemia, Glioma, Gastric Cancer MAT2A acts as an oncogenic driver by supporting methionine metabolism, crucial for MLLr leukemia (Fitzel et al. Neoplasia 2023), represents a vulnerability in H3K27M mutant glioma (Golbourn et al. Nat Cancer 2022), and protects cells from ferroptosis in gastric cancer via the MAT2A-ACSL3 pathway (Ma et al. Free Radic Biol Med 2022). Additionally, androgen-regulated alternative mRNA isoforms of MAT2A are linked with prostate cancer (Munkley et al. F1000Res 2018). MAT2A is implicated in various cancers through its roles in methionine metabolism and impact on epigenetic regulation. The evidence is derived from several recent studies focusing on the gene’s role in promoting oncogenesis and tumor survival, with one study published in Nat Cancer revealing MAT2A as a vulnerability in H3K27M gliomas. 7
TOP1 MYC-driven cancers A genome-wide CRISPR knockout screen in isogenic pairs of breast cancer cell lines reveals that TOP1 is a synthetic lethal vulnerability in MYC-driven cancers (Lin et al. Cancer Res 2023). Inhibition of TOP1 leads to accumulation of R-loops and reduced fitness of MYC-transformed tumors in vivo, and drug response to TOP1 inhibitors significantly correlates with MYC levels across several cancer cell lines and patient-derived organoids. There is strong evidence that TOP1 has a role as a cancer driver gene in MYC-driven cancers. The experiment used a genome-wide CRISPR knockout screen to identify synthetic lethal targets for MYC, finding that TOP1 is critical for the survival of cancers with high MYC activity. 7
MAP2K1 Lung adenocarcinoma, head and neck squamous cancer, pilocytic astrocytoma MAP2K1 mutations are associated with resistance to osimertinib in EGFR-mutated lung adenocarcinoma (Ito et al. 2023), and its expression is integrated into the APMHO prognostic score for head and neck squamous cancer (Zeng et al. 2023). MAP2K1 fusion has also been reported to activate the MAPK pathway in pilocytic astrocytoma (Yde et al. 2016). MAP2K1 has been implicated as playing a role in cancer, with evidence pointing to its involvement in drug resistance, tumor progression, and potentially as a predictive marker. The evidence is substantial but not overwhelming. 6
BIRC2 Cervical cancer Chr11q BFB event leading to YAP1/BIRC2/BIRC3 gene amplification is associated with earlier age of diagnosis in cervical cancer and is more common in African American women, suggesting potential for targeted therapy (Rodriguez et al., medRxiv, 2023) BIRC2 is implicated in cervical cancer, related to BFB cycles resulting in the gene's amplification. The study from a preprint provides insight into a specific amplification event on chromosome 11, which includes the BIRC2 gene. 4
FANCA Potentially implicated in general carcinogenesis FANCA was identified as one of the genes with BaP-induced mutations predicted to impact protein function in post-stasis HMEC. The mutated FANCA gene is cited as a high-confidence cancer driver gene. This was observed in human mammary epithelial cells exposed to the carcinogen BaP, which is known to produce mutations typical of human lung cancers in smokers (Severson et al., Mutat Res Genet Toxicol Environ Mutagen, 2014) FANCA has evidence of a role as a cancer driver gene from a single study that analyzed molecular changes in human mammary epithelial cells after carcinogen exposure. This is an indirect functional association, not a direct clinical demonstration 4
MYB Breast cancer No evidence from the provided study links MYB as a cancer driver in breast cancer (Ping et al., Scientific Reports, 2016) MYB was not identified as a cancer driver gene in the provided study. The study focused on breast cancer and MYB was not listed among the significantly associated genetic abnormalities 1

Here are some other example use-cases for this script; in my experience, pretty common types of tasks in biotech:

  • Analyze a set of genes and rank them by their importance in cancer metabolism, immune response, lupus, etc.
  • Analyze a set of compounds and rank them by their toxicity, potency, etc.
  • Analyze a set of bacterial strains and rank them by their presence in human microbiome, potential use as probiotics, etc.

With these kinds of queries, you'll likely get reasonable results, with the obvious candidates at the top (and perhaps a few surprises), comparable to what you might get from an inexperienced intern with unlimited time.


import json
import re
import requests

from pathlib import Path
from textwrap import dedent
from time import sleep
from urllib.parse import quote

from openai import OpenAI
client = OpenAI()

# Requires OpenAI API Key: https://openai.com/blog/openai-api
# os.environ["OPENAI_API_KEY"] = "sk-xxx"

SEARCH_PUBMED_URL = "https://eutils.ncbi.nlm.nih.gov/entrez/eutils/esearch.fcgi?db=pubmed&term={params}&retmax={max_abstracts}{api_key_param}"
GET_ABSTRACT_URL = "https://eutils.ncbi.nlm.nih.gov/entrez/eutils/efetch.fcgi?db=pubmed&id={pmid}&retmode=text&rettype=abstract{api_key_param}"
# https://www.ncbi.nlm.nih.gov/research/bionlp/APIs/BioC-PubMed/
BIOC_PMCID_URL = "https://www.ncbi.nlm.nih.gov/research/bionlp/RESTful/pmcoa.cgi/BioC_json/{pmcid}/unicode"

DEFAULT_MAX_ABSTRACTS = 30

# NCBI recommends that users post no more than three URL requests per second and limit large jobs
# Failure to comply with this policy may result in an IP address being blocked from accessing NCBI.
# Add an API key if you want to download faster
NCBI_API_KEY = None

def remove_ref_blank_entries_and_offsets(obj):
    """
    Recursively traverse through the JSON object (dict or list) and:
    1. Remove any node if it or any of its nested structures contains a dict with 'section_type': 'REF'.
    2. Remove any key-value pairs where the value is an empty list or empty dictionary.
    3. Remove any key-value pairs where the key is 'offset'.
    """
    if isinstance(obj, dict):
        # Check if any value of this dict is a nested dict with 'section_type': 'REF'
        if any(isinstance(v, dict) and v.get('section_type') == 'REF' for v in obj.values()):
            return None
        else:
            # No nested dict with 'section_type': 'REF', recursively process each key-value pair
            return {k: remove_ref_blank_entries_and_offsets(v) for k, v in obj.items() if k != 'offset' and
                       remove_ref_blank_entries_and_offsets(v) is not None and v != [] and v != {}}
    elif isinstance(obj, list):
        # Recursively process each item in the list
        return [remove_ref_blank_entries_and_offsets(item) for item in obj
                if remove_ref_blank_entries_and_offsets(item) is not None and item != [] and item != {}]
    else:
        # Return the item as is if it's not a dict or list
        return obj


def main(genes, role, max_abstracts=DEFAULT_MAX_ABSTRACTS, ncbi_api_key=NCBI_API_KEY):
    """Download abstracts and fulltext from pubmed, generate a prompt, query OpenAI.
    """
    Path("downloads").mkdir(exist_ok=True)
    Path("gpt_output").mkdir(exist_ok=True)

    api_key_param = "&api_key={ncbi_api_key}" if ncbi_api_key is not None else ""

    for gene in genes:
        abstracts = []
        fulltexts = []

        params = quote(f'({gene}) AND ("{role}")')

        pmtxt = requests.get(SEARCH_PUBMED_URL.format(params=params, max_abstracts=max_abstracts, api_key_param=api_key_param)).text
        pmids = re.findall("<Id>(\d+)</Id>", pmtxt)
        sleep(0.3)

        for pmid in pmids:
            if Path(f"downloads/abstract.pmid_{pmid}.txt").exists():
                abstracts.append(open(f"downloads/abstract.pmid_{pmid}.txt").read())
                if Path(f"downloads/fulltext.pmid_{pmid}.json").exists():
                    fulltexts.append(json.load(open(f"downloads/fulltext.pmid_{pmid}.json")))
                continue

            abstract = requests.get(GET_ABSTRACT_URL.format(pmid=pmid, api_key_param=api_key_param)).text
            open(f"downloads/abstract.pmid_{pmid}.txt", 'w').write(abstract)
            abstracts.append(abstract)
            sleep(0.3)

            pmcid = re.findall("^PMCID:\s+(PMC\S+)$", abstract, re.MULTILINE)
            assert len(pmcid) <= 1, "there should be max one PMCID per paper"
            pmcid = pmcid[0] if len(pmcid) == 1 else None

            if pmcid is not None:
                fulltext_request = requests.get(BIOC_PMCID_URL.format(pmcid=pmcid))
                if fulltext_request.status_code == 200:
                    fulltext_json = remove_ref_blank_entries_and_offsets(fulltext_request.json())
                    json.dump(fulltext_json, open(f"downloads/fulltext.pmid_{pmid}.json", 'w'), indent=2)
                    fulltexts.append(fulltext_json)
                sleep(0.3)

        # If there are only a couple of papers then we can include the fulltext
        # 250k characters should be well below 100k tokens; 500k characters is too many
        abstract_len = len("\n".join(abstracts))
        fulltext_len = len("\n".join(json.dumps(j) for j in fulltexts))
        if abstract_len + fulltext_len < 250_000:
            abstracts_txt = "\n".join(abstracts) + "\n" + "\n".join(json.dumps(j) for j in fulltexts)
        else:
            abstracts_txt = "\n".join(abstracts)

        gpt_out = f"gpt_output/{gene}_{role.replace(' ','_')}.txt"
        if len(abstracts_txt) > 1_000 and not Path(gpt_out).exists():
            completion = client.chat.completions.create(
                model="gpt-4-1106-preview",
                messages=[
                {"role": "system",
                "content": dedent("""
                You are an autoregressive language model that has been fine-tuned with instruction-tuning and RLHF.
                You carefully provide accurate, factual, thoughtful, nuanced answers, and are brilliant at reasoning. 
                If you think there might not be a correct answer, you say so. 
                Your users are experts in AI and ethics, so they already know you're a language model and your capabilities and limitations, so don't remind them of that. 
                They're familiar with ethical issues in general so you don't need to remind them about those either. 
                Don't be verbose in your answers, but do provide details and examples where it might help the explanation.

                Your users are also experts in science, and especially biology, medicine, statistics. 
                Do NOT add any details about how science or research works, tell me to ask my doctor or consult with a health professional.
                Do NOT add any details that such an expert would already know.
                """)},
                {"role": "user", 
                "content": dedent(f"""
                Help me research whether this gene has the role of {role}: {gene}. 
                Here are the top abstracts from pubmed, and any full text that will fit in context:

                {abstracts_txt}

                Read and synthesize all the evidence from these papers.
                Prefer evidence from good journals and highly cited papers, and papers that are recent.
                If there is one standout result in a top journal like Nature, Science or Cell, focus on that.
                There should usually be one primary result and most of the evidence should depend on that.

                Include a score out of 10, where 1 would be a single paper with weak evidence,
                5 would be a mid-tier journal with a single paper with believable evidence,
                and 10 would be multiple Nature, Science or Cell papers with very strong evidence.
                A score above 7 is exceptional, implying at least the result has been replicated and is trustworthy.

                Make sure the results are valid json with fields exactly as in the examples below.
                Do NOT change the fields, change the order, or add any other fields.
                The "Gene" json entry MUST match the query gene. Here, {gene}.                
                Include AT LEAST ONE reference for each entry on evidence (unless there is no evidence), e.g., (Smith et al., Nature, 2021). ALWAYS include the journal name.
                To help you think step-by-step about your response, use the FIRST "Summary" entry to summarize the question
                and the relevant available evidence in your own words, in one hundred words or fewer.
                Do NOT output markdown, just raw json. The first character should be {{ and the last character should be }}.

                Here are some examples of json you might output:

                {{
                "Summary": "ABC1 has no evidence of {role}. The experiments are not convincing. There is some evidence for ABC2, which may indicate something."; // string
                "Gene": "ABC1", // string
                "Cancer type": "", // string
                "Evidence": "No evidence as {role}", // string
                "Score": 0 // integer from 0-10
                }}

                {{
                "Summary": "There is some evidence for ABC2, which may indicate something. The evidence is medium, e.g. a paper in a mid-tier journal" // string
                "Gene": "DEF2", // string
                "Cancer type": "Bladder cancer", // string
                "Evidence": "A CRISPR screen identified DEF2 as {role} in bladder cancer (Jones et al., Nature Cancer, 2001)", // string
                "Score": 5 // integer from 0-10
                }}

                {{
                "Summary": "GHI3 has been cited as {role} many times. The experiments are convincing. The evidence is strong: a recent Nature paper and a Science paper" // string
                "Gene": "GHI3" // string
                "Cancer type": "Colorectal cancer" // string
                "Evidence": "A cell-based assay using a small molecule inhibitor identified GHI3 as {role} in colorectal cancer (Smith et al., Science, 2022, Thomson et al., Nature, 2019)", // string
                "Score": 8 // integer from 0-10
                }}
                """)
                }
            ]
            )
            open(gpt_out, 'w').write(completion.choices[0].message.content)
        else:
            # just log null results
            open(gpt_out, 'w').write("")

if __name__ == "__main__":
    main(genes = ["MAP2K1", "F5"], role = "cancer driver")
Comment

For a long time, the dream has been to be able to test code on your laptop and transparently scale it to infinite compute on the cloud. There are many, many tools that can help you do this, but modal, a new startup, comes closer to a seamless experience than anything I've used before.

There is a really nice quickstart, and they even include a generous $30/month to help get your feet wet.

pip install modal
python3 -m modal setup
git clone https://github.com/hgbrian/biomodals
cd biomodals
modal run modal_omegafold.py --input-fasta modal_in/omegafold/insulin.fasta


OmegaFold

Here's an example of how to use modal to run OmegaFold. OmegaFold is an AlphaFold/ESMFold/ColabFold-like algorithm. It is much easier to run than AlphaFold (which needs 2TB+ of reference data!) and it performs well according to a recent benchmark by 310.ai.

import glob
from subprocess import run
from pathlib import Path
from modal import Image, Mount, Stub

FORCE_BUILD = False
MODAL_IN = "./modal_in"
MODAL_OUT = "./modal_out"

stub = Stub()

image = (Image
         .debian_slim()
         .apt_install("git")
         .pip_install("git+https://github.com/HeliXonProtein/OmegaFold.git", force_build=FORCE_BUILD)
        )

@stub.function(image=image, gpu="T4", timeout=600,
               mounts=[Mount.from_local_dir(MODAL_IN, remote_path="/in")])
def omegafold(input_fasta:str) -> list[tuple[str, str]]:
    input_fasta = Path(input_fasta)
    assert input_fasta.parent.resolve() == Path(MODAL_IN).resolve(), f"wrong input_fasta dir {input_fasta.parent}"
    assert input_fasta.suffix in (".faa", ".fasta"), f"not fasta file {input_fasta}"

    run(["mkdir", "-p", MODAL_OUT], check=True)
    run(["omegafold", "--model", "2", f"/in/{input_fasta.name}", MODAL_OUT], check=True)

    return [(pdb_file, open(pdb_file, "rb").read())
            for pdb_file in glob.glob(f"{MODAL_OUT}/**/*.pdb", recursive=True)]

@stub.local_entrypoint()
def main(input_fasta):
    outputs = omegafold.remote(input_fasta)

    for (out_file, out_content) in outputs:
        Path(out_file).parent.mkdir(parents=True, exist_ok=True)
        if out_content:
            with open(out_file, 'wb') as out:
                out.write(out_content)

Hopefully the code is relatively self-explanatory. It's just Python code with code to set up the docker image, and some decorators to tell modal how to run the code on the cloud.

There are only really two important lines: installing OmegaFold with pip:

.pip_install("git+https://github.com/HeliXonProtein/OmegaFold.git", force_build=FORCE_BUILD)

and running OmegaFold:

run(["omegafold", "--model", "2", f"/in/{input_fasta.name}", MODAL_OUT], check=True)

The rest of the code could be left unchanged and reused for many bioinformatics tools. For example, to run minimap2 I would just add:

.run_commands("git clone https://github.com/lh3/minimap2 && cd minimap2 && make")

Finally, to run the code:

modal run modal_omegafold.py --input-fasta modal_in/omegafold/insulin.fasta


Outputs

Modal has extremely nice, almost real-time logging and billing.

CPU and GPU usage for an OmegaFold run. Note how it tracks fractional CPU/GPU use.


Billing information for the same run, split into CPU, GPU, RAM.

This OmegaFold run cost me 3c and took about 3 minutes. So if I wanted to run OmegaFold on a thousand proteins I could probably do the whole thing for ~$100 in minutes. (I'm not sure since my test protein is short, and I don't know how many would run in parallel.) In theory, someone reading this article could go from never having heard of modal or OmegaFold to folding thousands proteins in well under an hour. That is much faster than any alternative I can think of.


Modal vs Docker

Why not just use Docker? Docker has been around forever and you can just make a container and run it the same way! Modal even uses Docker under the hood!

There are significant differences:

  • Dockerfiles are weird, have their own awful syntax, and are hard to debug;
  • you have to create and manage your own images;
  • you have to manage running your containers and collecting the output.

I have a direct equivalent to the above OmegaFold modal script that uses Docker, and it includes:

  • a Dockerfile (30 lines);
  • a Python script (80 lines, including copying files to and from buckets);
  • a simple bash script to build and push the image (5 lines);
  • and finally a script to run the Dockerfile on GCP (40 lines, specifying machine types, GPUs, RAM, etc).

Also, Docker can be slow to initialize, at least when I run my Docker containers on GCP. Modal has some impressive optimizations and cacheing (which I do not understand). I find I am rarely waiting more than a minute or two for scripts to start.


Modal vs snakemake, nextflow, etc

There is some overlap here, but in general the audience is different. Nextflow Tower may be a sort-of competitor, I have not tried to use it.

The advantages of these workflow systems over modal / Python scripts are mainly:

  • you can separate your process into many atomic steps;
  • you can parameterize different runs and keep track of parameters;
  • you can cache steps and restart after a failure (a major advantage of e.g., redun).

However, for many common tasks like protein folding (OmegaFold, ColabFold), genome assembly (SPAdes), read mapping (minimap2, bwa), there is one major step — executing a binary — and it's unclear if you need to package the process in a workflow.


Pricing

Modal is priced per second so you don't pay for more than you use.

Modal runs (transparently) on AWS, GCP, and Oracle. Another blogpost claims that Modal adds around a 12% margin. However, since Modal charges per cycle, I think it's possible you could end up saving quite a bit of money? If you run your own Docker image on a VM, you may end up paying a lot for idle time; for example, if your GPU is utilized for a fraction of the time (as with AlphaFold). It's very unclear to me how modal makes this work (or if I am misunderstanding something), but it's really nice to not have to worry about maximizing utilization.

One challenge with modal — and all cloud compute — for bioinformatics is having to push large files around (e.g., TB of sequencing reads). If you want to do that efficiently you may have to look into the modal's Volumes feature so larger files only get uploaded once.


Conclusion

Not too long ago, I felt I had to do almost everything on a linux server, since my laptop did not have enough RAM, or any kind of GPU. Now with the M-series MacBook Pros, you get a GPU and as much RAM as high end server (128GB!) I still need access to hundreds of cores and powerful GPUs, but only for defined jobs.

I am pretty excited about modal's vision of "serverless" compute. I think it's a big step forward in how to manage compute. Their many examples are illustrative. Never having to think about VMs or even having to choose a cloud is a big deal, especially these days when GPUs are so hard to find (rumor has it Oracle has spare A100's, etc!) Although it's an early startup, there is almost no lock-in with modal since everything is just decorated Python.

I made a basic biomodals repo and added some examples.

Comment
Brian Naughton | Sun 03 October 2021 | datascience | statistics datascience

I really like resampling methods for data analysis, and I think they are under-utilized. The main thing these techniques have in common is that instead of an analytical solution, they make a computer repeatedly analyze variations of the data. Examples of resampling methods include permutation tests, the bootstrap, and cross-validation.

Cross-validation in particular seems to have really taken over model selection over the last ten years or so (e.g., compared to the more "statistical" AIC or BIC). There may be an argument here that this is due to non-statisticians needing statistical tests (e.g., in machine learning) so they naturally gravitate to using computational power instead of statistical expertise.

In biology, there are a few tests than come up a lot, but the main one is probably testing if distribution A is different to distribution B (e.g., experiment vs control). This is usually done with a t-test, but can also be done — with some advantages — by a permutation test. I looked for a post on this topic but could not find one that exactly covered what I was interested in, so this article will show some data on this.

Here are a few related articles that may be of interest:

The t-test

I would guess most biologists use t-tests occasionally, as the simplest way to check if an experimental result differs from a control. I would also argue that most people who use the t-test don't really know the main assumptions:

  • the distributions are normal
  • the variances of the distributions are equal
  • the sample size is large

If you violate any of these assumptions, you are supposed to consider another test.

If distributions are not normal

We usually assume if a distribution is not normal then it's some unknown distribution. In this case you could use a non-parametric test, like the Mann–Whitney U test. Of course, there's no such thing as a completely normal distribution, so it's a bit unclear where to draw the line here.

If variances are unequal

If the variances are unequal, Welch's t-test is recommended. Welch's t-test is "an adaptation of Student's t-test, and is more reliable when the two samples have unequal variances and/or unequal sample sizes." I'm not sure I've ever seen this test used in a biology paper, though variances are very often unequal. For example, any time you are counting things (colonies, etc) it's likely a Poisson distribution where the variance equals the mean.

If sample size is small

It's a bit of a grey area how few samples count as "small", but some sources say below 30. That is actually a pretty large number for many biological experiments!

For example, if I do a quick review of the first four papers that pop up for the search "xenograft tumor treatment t-test":

In order to publish, the authors of these papers need to be able to report a p-value, and the t-test is the most convenient, and accepted tool.

Violations

It's possible that the above violations in assumptions are just fine, and the stats work out fine. Still, the lack of clarity on what counts as a violation here seems to defeat the purpose of having the rules, and a permutation test might offer a safer approach.

Permutation Test

The general problem below will be to determine if two distributions with mean of 0 (red) and diff (yellow), are different.

from scipy.stats import norm, laplace, ttest_ind, median_test, mannwhitneyu, pearsonr, linregress
from matplotlib import pyplot as plt
from IPython.display import SVG
import seaborn as sns
import pandas as pd
import numpy as np

from tqdm.auto import tqdm
tqdm.pandas()
f, ax = plt.subplots(figsize=(12,4))
diff = 1
dist1 = norm(0, 1).rvs(100)
dist2 = norm(diff, 1).rvs(100)
sns.histplot(dist1, color='r', bins=40);
sns.histplot(dist2, color='y', bins=40);

png

This is the code for a permutation test, for use in place of a one- or two-sided t-test, Welch's t-test, etc. In all examples below I will use a two-sided t-test, since this is more commonly used than one-sided. (Although to me, one-sided makes more sense most the time!)

def ptest_ind(dist1, dist2, fn=np.mean, N=30000, alternative="two-sided"):
    """permutation test, matching scipy.ttest_ind syntax"""
    from collections import namedtuple
    from warnings import warn

    PTResult = namedtuple("PTResult", ["stat", "pvalue"])

    new_dists = np.concatenate([dist1, dist2])
    test = fn(dist1) - fn(dist2)

    res = []
    for _ in range(N):
        np.random.shuffle(new_dists)
        ndist1 = new_dists[:len(dist1)]
        ndist2 = new_dists[len(dist1):]
        res.append(test > fn(ndist1) - fn(ndist2))

    stat = sum(res) / N

    if alternative == "less":
        pvalue = stat
    elif alternative == "greater":
        pvalue = 1 - stat
    elif alternative == "two-sided":
        pvalue = 2*min(stat, 1-stat)
    else:
        raise ValueError(f"{alternative=}")

    if pvalue == 0:
        warn(f"permutation test sample limit reached: <1/{N}")
        pvalue = 1.0/N

    return PTResult(stat, pvalue)
def plot_corr(df, x, y, min_xy):
    """Plot the correlation between two tests, and report Pearson's r"""
    lx, ly = f"log_{x}", f"log_{y}"
    _df = (df_rows
             .replace([np.inf, -np.inf], np.nan)
             .dropna()
             .assign(**{lx: lambda df: df[x].apply(np.log10), ly: lambda df: df[y].apply(np.log10)}))

    res = linregress(_df[ly], _df[lx])

    f, ax = plt.subplots(figsize=(6,6))
    sns.scatterplot(data=_df, x=lx, y=ly, ax=ax);
    sns.lineplot(x=np.array([0, min_xy]), y=res.intercept + res.slope*np.array([0, min_xy]), color='r', linewidth=0.5, ax=ax)
    ax.set_xlim(min_xy, 0);
    ax.set_ylim(min_xy, 0);
    ax.axline((min_xy, min_xy), (0, 0), linewidth=0.5, color='g');

    return res.rvalue

t-test with normal distributions

This is the simplest case: comparing two equal variance, high sample size, normal distributions. Here we see an almost perfect correspondence between the results of the t-test and permutation test. This is good, since it shows the permutation test is not reporting biased (e.g., too low) p-values.

sample_size = 30

rows = []
for diff in tqdm(np.tile(np.arange(0, 0.4, 0.02), 1)):
    dist1 = norm(0, 1).rvs(sample_size)
    dist2 = norm(diff, 1).rvs(sample_size)

    tt = ttest_ind(dist1, dist2, alternative="two-sided").pvalue
    pt = ptest_ind(dist1, dist2, alternative="two-sided").pvalue

    rows.append((tt, pt))

df_rows = pd.DataFrame(rows, columns=["tt", "pt"])
print(f't-test vs permutation r: {plot_corr(df_rows, "tt", "pt", -3):.3f}')
t-test vs permutation r: 1.000

png

t-test with normal distributions, but low sample size

What happens to the results of a t-test when the number of samples is low? Here, the low sample size results in some noise that decreases the correlation, but it still seems to work very similarly to the permutation test, even with just 3 samples (despite the regression line below).

sample_size = 3

rows = []
for diff in tqdm(np.tile(np.arange(0, 0.6, 0.03), 5)):
    dist1 = norm(0, 1).rvs(sample_size)
    dist2 = norm(diff, 1).rvs(sample_size)

    tt = ttest_ind(dist1, dist2, alternative="two-sided").pvalue
    pt = ptest_ind(dist1, dist2, alternative="two-sided").pvalue

    rows.append((tt, pt))

df_rows = pd.DataFrame(rows, columns=["tt", "pt"])
print(f't-test vs permutation r: {plot_corr(df_rows, "tt", "pt", -2):.3f}')
/tmp/ipykernel_2790/1233266942.py:30: UserWarning: permutation test sample limit reached: <1/30000
  warn(f"permutation test sample limit reached: <1/{N}")


t-test vs permutation r: 0.760

png

t-test with normal distributions, but unequal variances

scipy's ttest_ind has an option to use Welch's t-test instead of a t-test. Again, the results are almost identical between Welch's t-test and the permutation test.

sample_size = 30

rows = []
for diff in tqdm(np.tile(np.arange(0, 1.5, 0.075), 5)):
    dist1 = norm(0, 1).rvs(sample_size)
    dist2 = norm(diff, 2).rvs(sample_size)

    tt = ttest_ind(dist1, dist2, alternative='two-sided', equal_var=False).pvalue
    pt = ptest_ind(dist1, dist2, alternative="two-sided").pvalue

    rows.append((tt, pt))

df_rows = pd.DataFrame(rows, columns=["tt", "pt"])
print(f't-test vs permutation r: {plot_corr(df_rows, "tt", "pt", -3):.3f}')
/tmp/ipykernel_2790/1233266942.py:30: UserWarning: permutation test sample limit reached: <1/30000
  warn(f"permutation test sample limit reached: <1/{N}")


t-test vs permutation r: 0.967

png

t-test with non-normal distributions

In this case, the Mann-Whitney U test is usually recommended instead of the t-test. The Mann-Whitney U test "is a nonparametric test of the null hypothesis that, for randomly selected values X and Y from two populations, the probability of X being greater than Y is equal to the probability of Y being greater than X." However, two distributions can have equal medians, but different distributions, and Mann-Whitney may return a significant p-value.

Another option is to directly test for a difference in medians, with Mood's median test.

I'm not sure why the permutation test and median test results don't match more closely here, though the median test only produces a few possible p-values. Still, the results are quite close, and appear unbiased. The correlation between the permutation tests and Mann-Whitney U test is also very high.

sample_size = 30

rows = []
for diff in tqdm(np.tile(np.arange(0, 0.5, 0.025), 5)):
    dist1 = laplace(0, 1).rvs(sample_size)
    dist2 = laplace(diff, 1).rvs(sample_size)

    mt = median_test(dist1, dist2, ties="ignore")[1] # ugh, inconsistent scipy syntax
    ut = mannwhitneyu(dist1, dist2, alternative="two-sided")[1] # ugh, inconsistent scipy syntax
    pt = ptest_ind(dist1, dist2, fn=np.median, alternative="two-sided").pvalue

    rows.append((mt, ut, pt))

df_rows = pd.DataFrame(rows, columns=["mt", "ut", "pt"])
print(f'median test vs permutation r:  {plot_corr(df_rows, "mt", "pt", -3):.3f}')
print(f'mann-whitney vs permutation r: {plot_corr(df_rows, "ut", "pt", -3):.3f}')
print(f'mann-whitney vs median test r: {plot_corr(df_rows, "ut", "mt", -3):.3f}')
median test vs permutation r:  0.863
mann-whitney vs permutation r: 0.920
mann-whitney vs median test r: 0.873

png

png

png

t-test with normal distributions, but one outlier sample

A common problem with real-world datasets is outlier datapoints that greatly skew the distribution and hence skew p-values. Removing or accounting for outliers will increase the robustness of a test (e.g., how sensitive the result is to an erroneous reading).

It's interesting that the t-test is reasonably well correlated with the other two tests, but way off the diagonal.

sample_size = 30

rows = []
for diff in tqdm(np.tile(np.arange(0, 0.5, 0.025), 5)):
    dist1 = np.concatenate([norm(0, 1).rvs(sample_size), np.array([0])])
    dist2 = np.concatenate([norm(diff, 1).rvs(sample_size), np.array([100])])

    mt = mannwhitneyu(dist1, dist2, alternative='two-sided').pvalue
    tt = ttest_ind(dist1, dist2, alternative="two-sided").pvalue
    pt = ptest_ind(dist1, dist2, fn=np.median, alternative="two-sided").pvalue

    rows.append((mt, tt, pt))

df_rows = pd.DataFrame(rows, columns=["mt", "tt", "pt"])

print(f'mann-whitney vs permutation r: {plot_corr(df_rows, "mt", "pt", -3):.3f}')
print(f't-test vs mann-whitney r:      {plot_corr(df_rows, "tt", "mt", -3):.3f}')
print(f't-test vs permutation r:       {plot_corr(df_rows, "tt", "pt", -3):.3f}')
mann-whitney vs permutation r: 0.923
t-test vs mann-whitney r:      0.926
t-test vs permutation r:       0.835

png

png

png

Conclusion

In general, the permutation test gives you the same answer you would get if you chose the "right" test for your task. But, you have to exert less effort in figuring out what the right test is.

There is a very direct connection between the test you want and the calculation performed. For example, with the Mann-Whitney U test, it's confusing what is actually being tested, apart from "the non-parametric alternative to a t-test".

The permutation test is also robust in a way that serves most use-cases. Outliers are handled conservatively, and there are few or no assumptions to violate.

Disadvantages

There are some disadvantages too, but relatively minor I think.

  • Regular t-tests do pretty well in my tests above, even with only 3 samples! The only major problem is with outliers, which can imply extremely wide distributions if taken at face-value.
  • Permutation tests can be slow, so if you are doing thousands of tests, or you need precise, very low p-values, then they will likely not be suitable.
  • You have to know precisely what you are testing. For example, "are the medians of these two distributions identical?". This is mostly an advantage in that it's more explicit.
  • You get more statistical power if you use the test that includes the correct assumptions. This seems to be a very minor effect in my tests above.

Overall, you can't go too far wrong with permutation tests since they are so simple. If nothing else, they are a good way to sanity check results from other tests with more assumptions.

Comment
Brian Naughton | Sat 02 January 2021 | datascience | metrology datascience

Using Bambi and brms to estimate the efficiency of electric cars.

Read More

A brief comparison of three bioinformatics workflow tools: nextflow, snakemake, reflow.

Read More

A list of tools for working remotely on a cloud instance.

Read More

Using several neural nets to create an instagram celebrity, Jake Dangerback.

Read More

Boolean Biotech © Brian Naughton Powered by Pelican and Twitter Bootstrap. Icons by Font Awesome and Font Awesome More